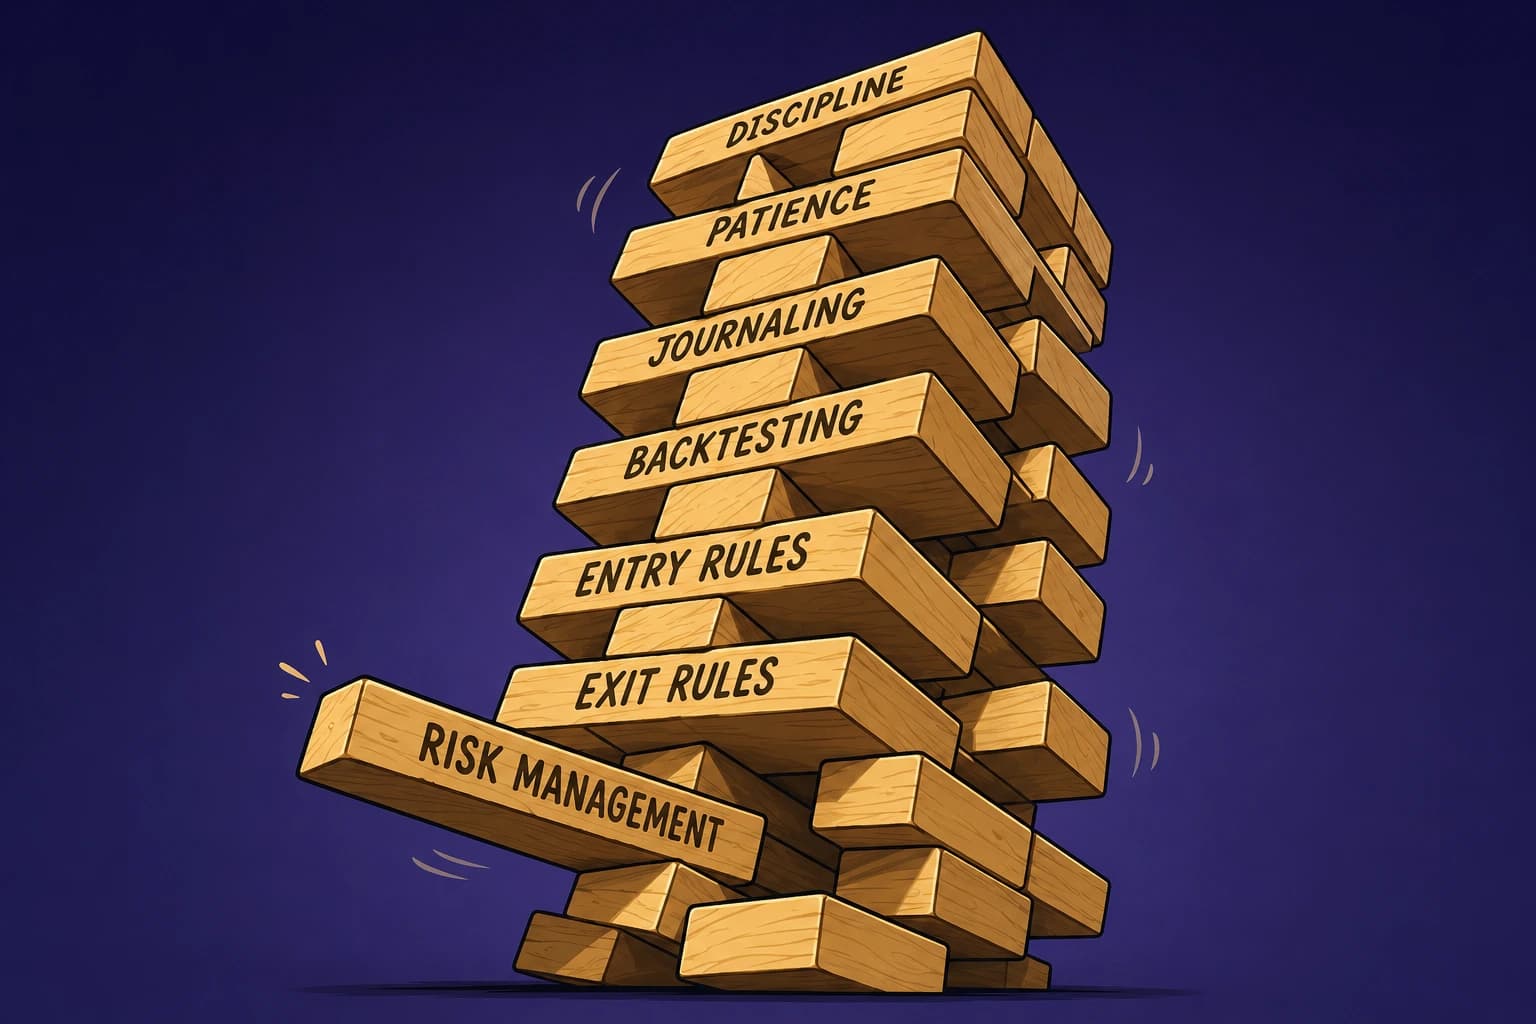
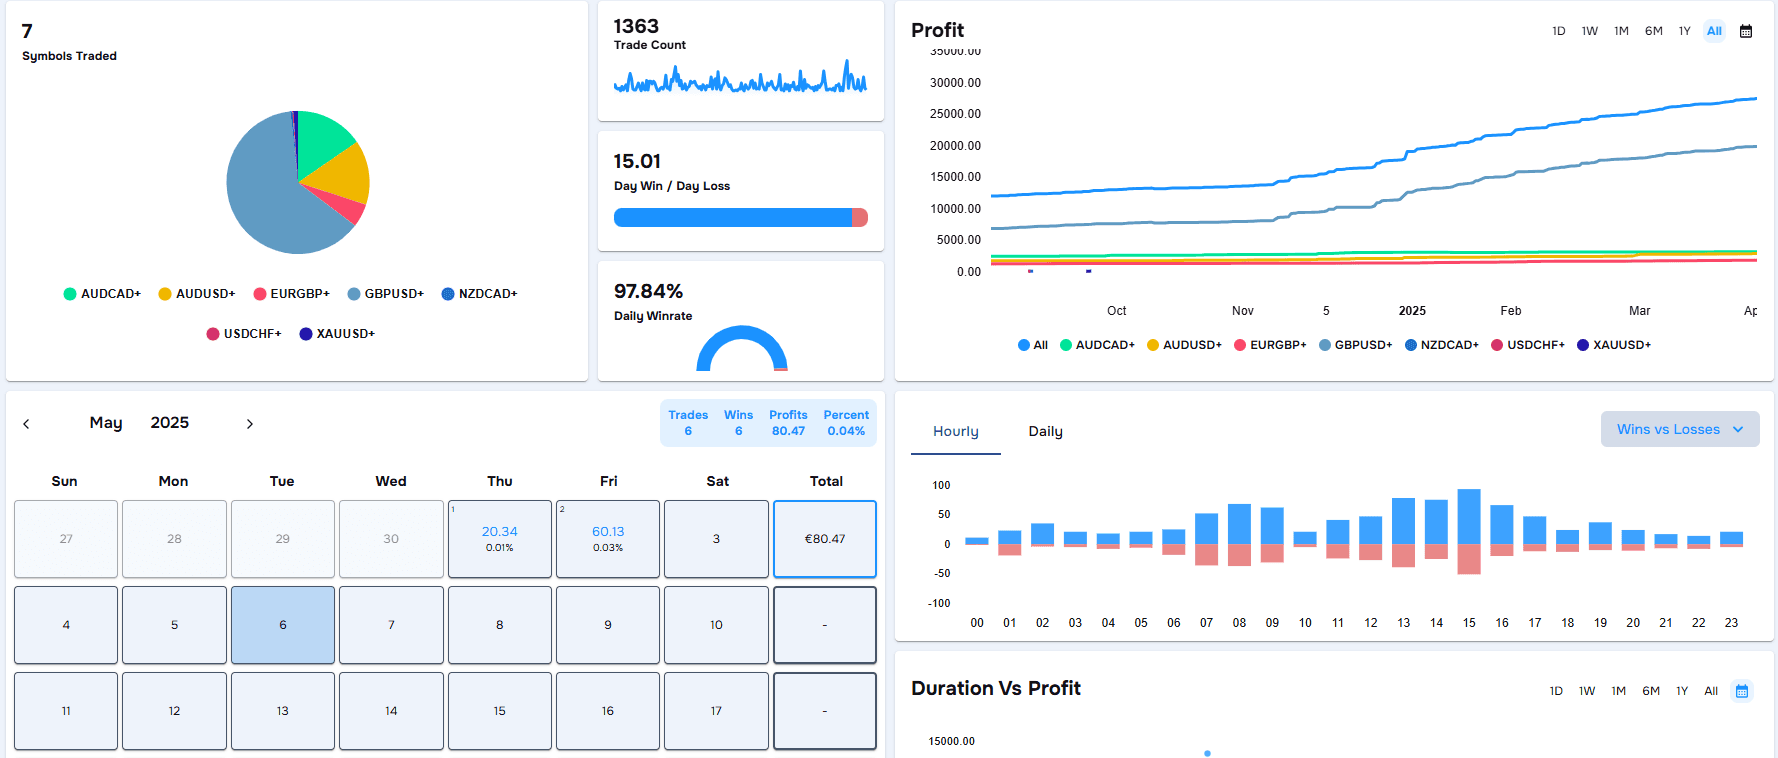
Why Your Win Rate Can Lie (And What to Check Instead)
Your win rate is 75%, yet your account is still in the red. How is that possible?
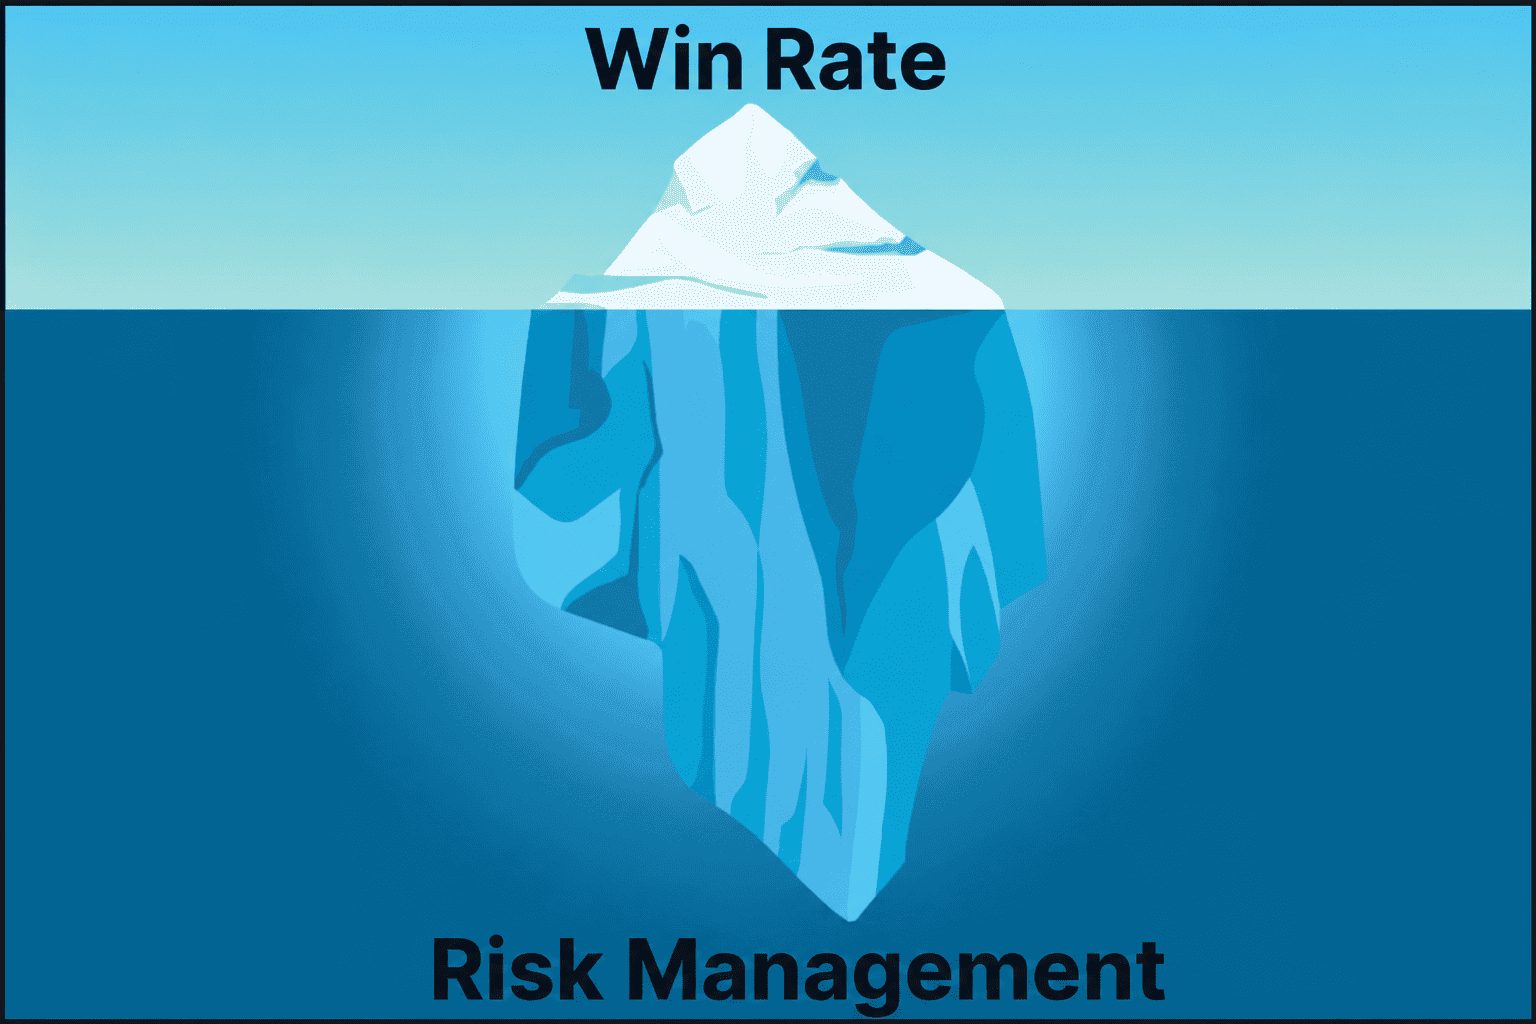
Many traders obsess over win rate while ignoring the bigger picture. A trading strategy isn't defined by how often it wins, but by the relationship between risk, reward, and overall profitability.
Trading risk management isn't about avoiding risk or simply risking 1% per trade — it's about understanding whether the reward justified the risk.
That's why a trader with a 25% win rate can outperform one with a 90% win rate when risk-reward ratios and position sizing are working in their favour.
This article opens our Risk Management series and explores why understanding risk is one of the most important skills a trader can develop.
Good Outcomes and Good Decisions Are Not the Same Thing
Picture two traders at the end of the same month. Trader A finishes up 3%. On paper, it looks like a success...right? Beneath the number, they sized up after a winning streak, moved a stop because the trade was "almost there," and caught a lucky runner on a setup they had never backtested. Meanwhile, Trader B finishes up 4%. Every trade followed the plan. Losses were cut at -1R. Winners reached +2R. Position sizing stayed consistent regardless of what happened the trade before. Most traders would prefer to have Trader A's result. Experienced traders would rather have Trader B's process.
The problem with looking only at P&L is that it shows the outcome, not the decisions behind it. It does not reveal whether profits came from skill or luck or whether losses came from poor execution or a strategy playing out exactly as expected. Focus solely on results and you reinforce bad habits while overlooking good ones.
Three traps almost every trader falls into at review time:
– Green week = good trading. Seven profitable days can hide negative expectancy or one outlier masking a weak system.
– High win rate = edge. An 82% win rate loses money when average losses are five times average wins. Arithmetic, not psychology.
– Best trade = proof of strategy. One +8R spike on a +0.1R system does not validate the setup. It validates overconfidence — often with larger size on the next entry.
The dangerous trade is not always your biggest loss. Sometimes it is the win that teaches you the wrong lesson.
Separate what happened from what you did. Did size match the rule? Did you exit on plan — or because the candle made you nervous? Those answers do not live in win rate or monthly P&L. They live in your trade journal — when you track mistakes and decision quality alongside the result.
Key takeaway: Review your performance through multiple trade metrics, for a well rounded view. The goal is not simply to know whether you made money. It is to understand whether you traded well.
Why a 25% Win Rate Can Beat a 95% Win Rate
Now, imagine Trader A has a 95% win rate and Trader B has a 25% win rate.Instinctively, most traders would assume Trader A is more profitable. After all, how could a trader who wins almost every trade be losing money?
Let's break down the numbers.
Trader A's average win is $20. Their average loss is $500.
19 winning trades × $20 = +$380
1 losing trade × $500 = -$500
Net result = -$120
Despite winning 95% of their trades, Trader A still loses money. On each trade, they risk $500 to make just $20. One loss wipes out more than an entire month's worth of gains.
Now let's look at Trader B.
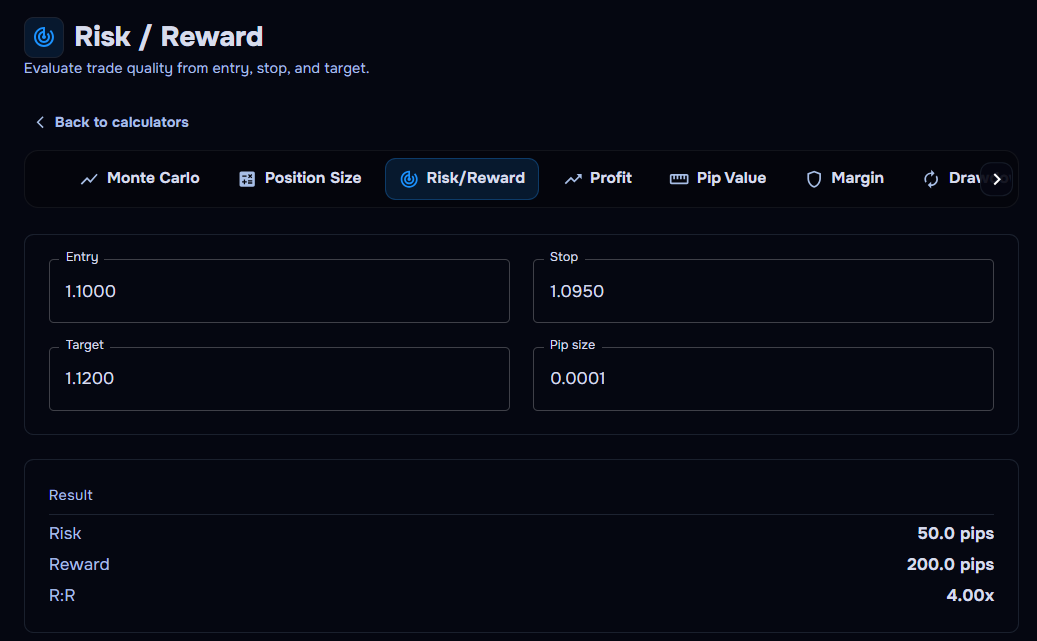
Trader B wins just 25% of their trades, but every trade follows a predefined risk management plan. They risk $100 (1R) to make $400 (4R) and keep their position size consistent regardless of previous outcomes.
Over four trades:
– 3 losing trades × -$100 (-1R) = -$300 (-3R)
– 1 winning trade × +$400 (+4R) = +$400 (+4R)
– Net result = +$100 (+1R)
Despite losing three out of every four trades, Trader B still finishes profitable. Why? Trader B focused on managing risk effectively rather than chasing a high win rate. They know exactly how much they're willing to risk on every trade, and their winners are large enough to cover the inevitable losses.
Trader A was right 95% of the time and still lost money. Trader B was wrong 75% of the time and still made money. That is where it is crucial to understand win rate vs risk reward. Win rate: how often am I right? Risk reward: when I am right, does it cover when I am wrong? Read one without the other and you misread your edge every time.
Before you abandon a setup or double size after a bad week, run the 3-question check:
1. Does expectancy work after costs? Does the average trade expect to make money once spreads and slippage are honest?
2. Can I survive the losing streak at this size? Position sizing decides whether your edge survives. Identical entries at 0.5% vs 2% risk are different careers.
3. Do I have enough trades to trust the number? A strong profit factor on twelve trades is not proof. One outlier can flatter a weak system for months.
Key takeaway: Your win rate doesn't define your risk management. Knowing how much you're prepared to lose, and whether the potential reward justifies that risk, does.
What Each Stat on Your Dashboard Is Really Judging
Every trader opens a dashboard, feels behind, and picks one number — usually win rate or P&L. That is how misreading starts.
Each metric answers one question. The skill is knowing which belong together:
– Win rate — How often am I right?
– Risk reward / expectancy — When I am right, does it pay enough?
– Position sizing — Can my account survive my strategy?
– Drawdown — Is risk discipline holding under pressure?
– Profit factor — Do gross wins outweigh gross losses — on enough trades?
– MAE — Did my stop match how price moved against me?
– MFE — How much profit was available before I exited?
– Sample size / backtesting — Have I seen enough of this edge to trust it live?
Asking the right questions of your trading data is how you build a clearer picture of your strengths, weaknesses, and overall risk management. Metrics such as MAE and MFE can reveal whether your stops and exits match reality, while profit factor and drawdown help determine whether your results are sustainable or being distorted by a handful of exceptional trades.
If you'd like to learn more, check out our Trading Definitions Glossary. Day traders juggling high volume may want to start with 5 day trading performance metrics you should actually track.
Key takeaway: Every trading metric should answer a question. The more questions your data can answer, the clearer your understanding of risk becomes.

Turning Risk Management Into a Repeatable Process
Understanding risk management is one thing. Applying it consistently is another.
The traders who manage risk best tend to break their workflow into two stages: before the trade and after the trade.
Pre-Trade: Define the Risk
Many traders know they should manage risk, but struggle to put a number on it. How much should they risk? Is the reward worth it? Could a losing streak damage the account more than expected?
This is where calculators become useful. Rather than relying on instinct, tools such as Risk/Reward, Position Size, Drawdown, Expectancy, and Risk of Ruin calculators help quantify the trade before capital is committed.
The same principle applies to strategy development. If you're unsure whether a setup genuinely has an edge, backtesting allows you to evaluate it against historical data before the market evaluates it with your money.
After the Trade
Once the trade is closed, a different challenge appears: understanding what actually happened.
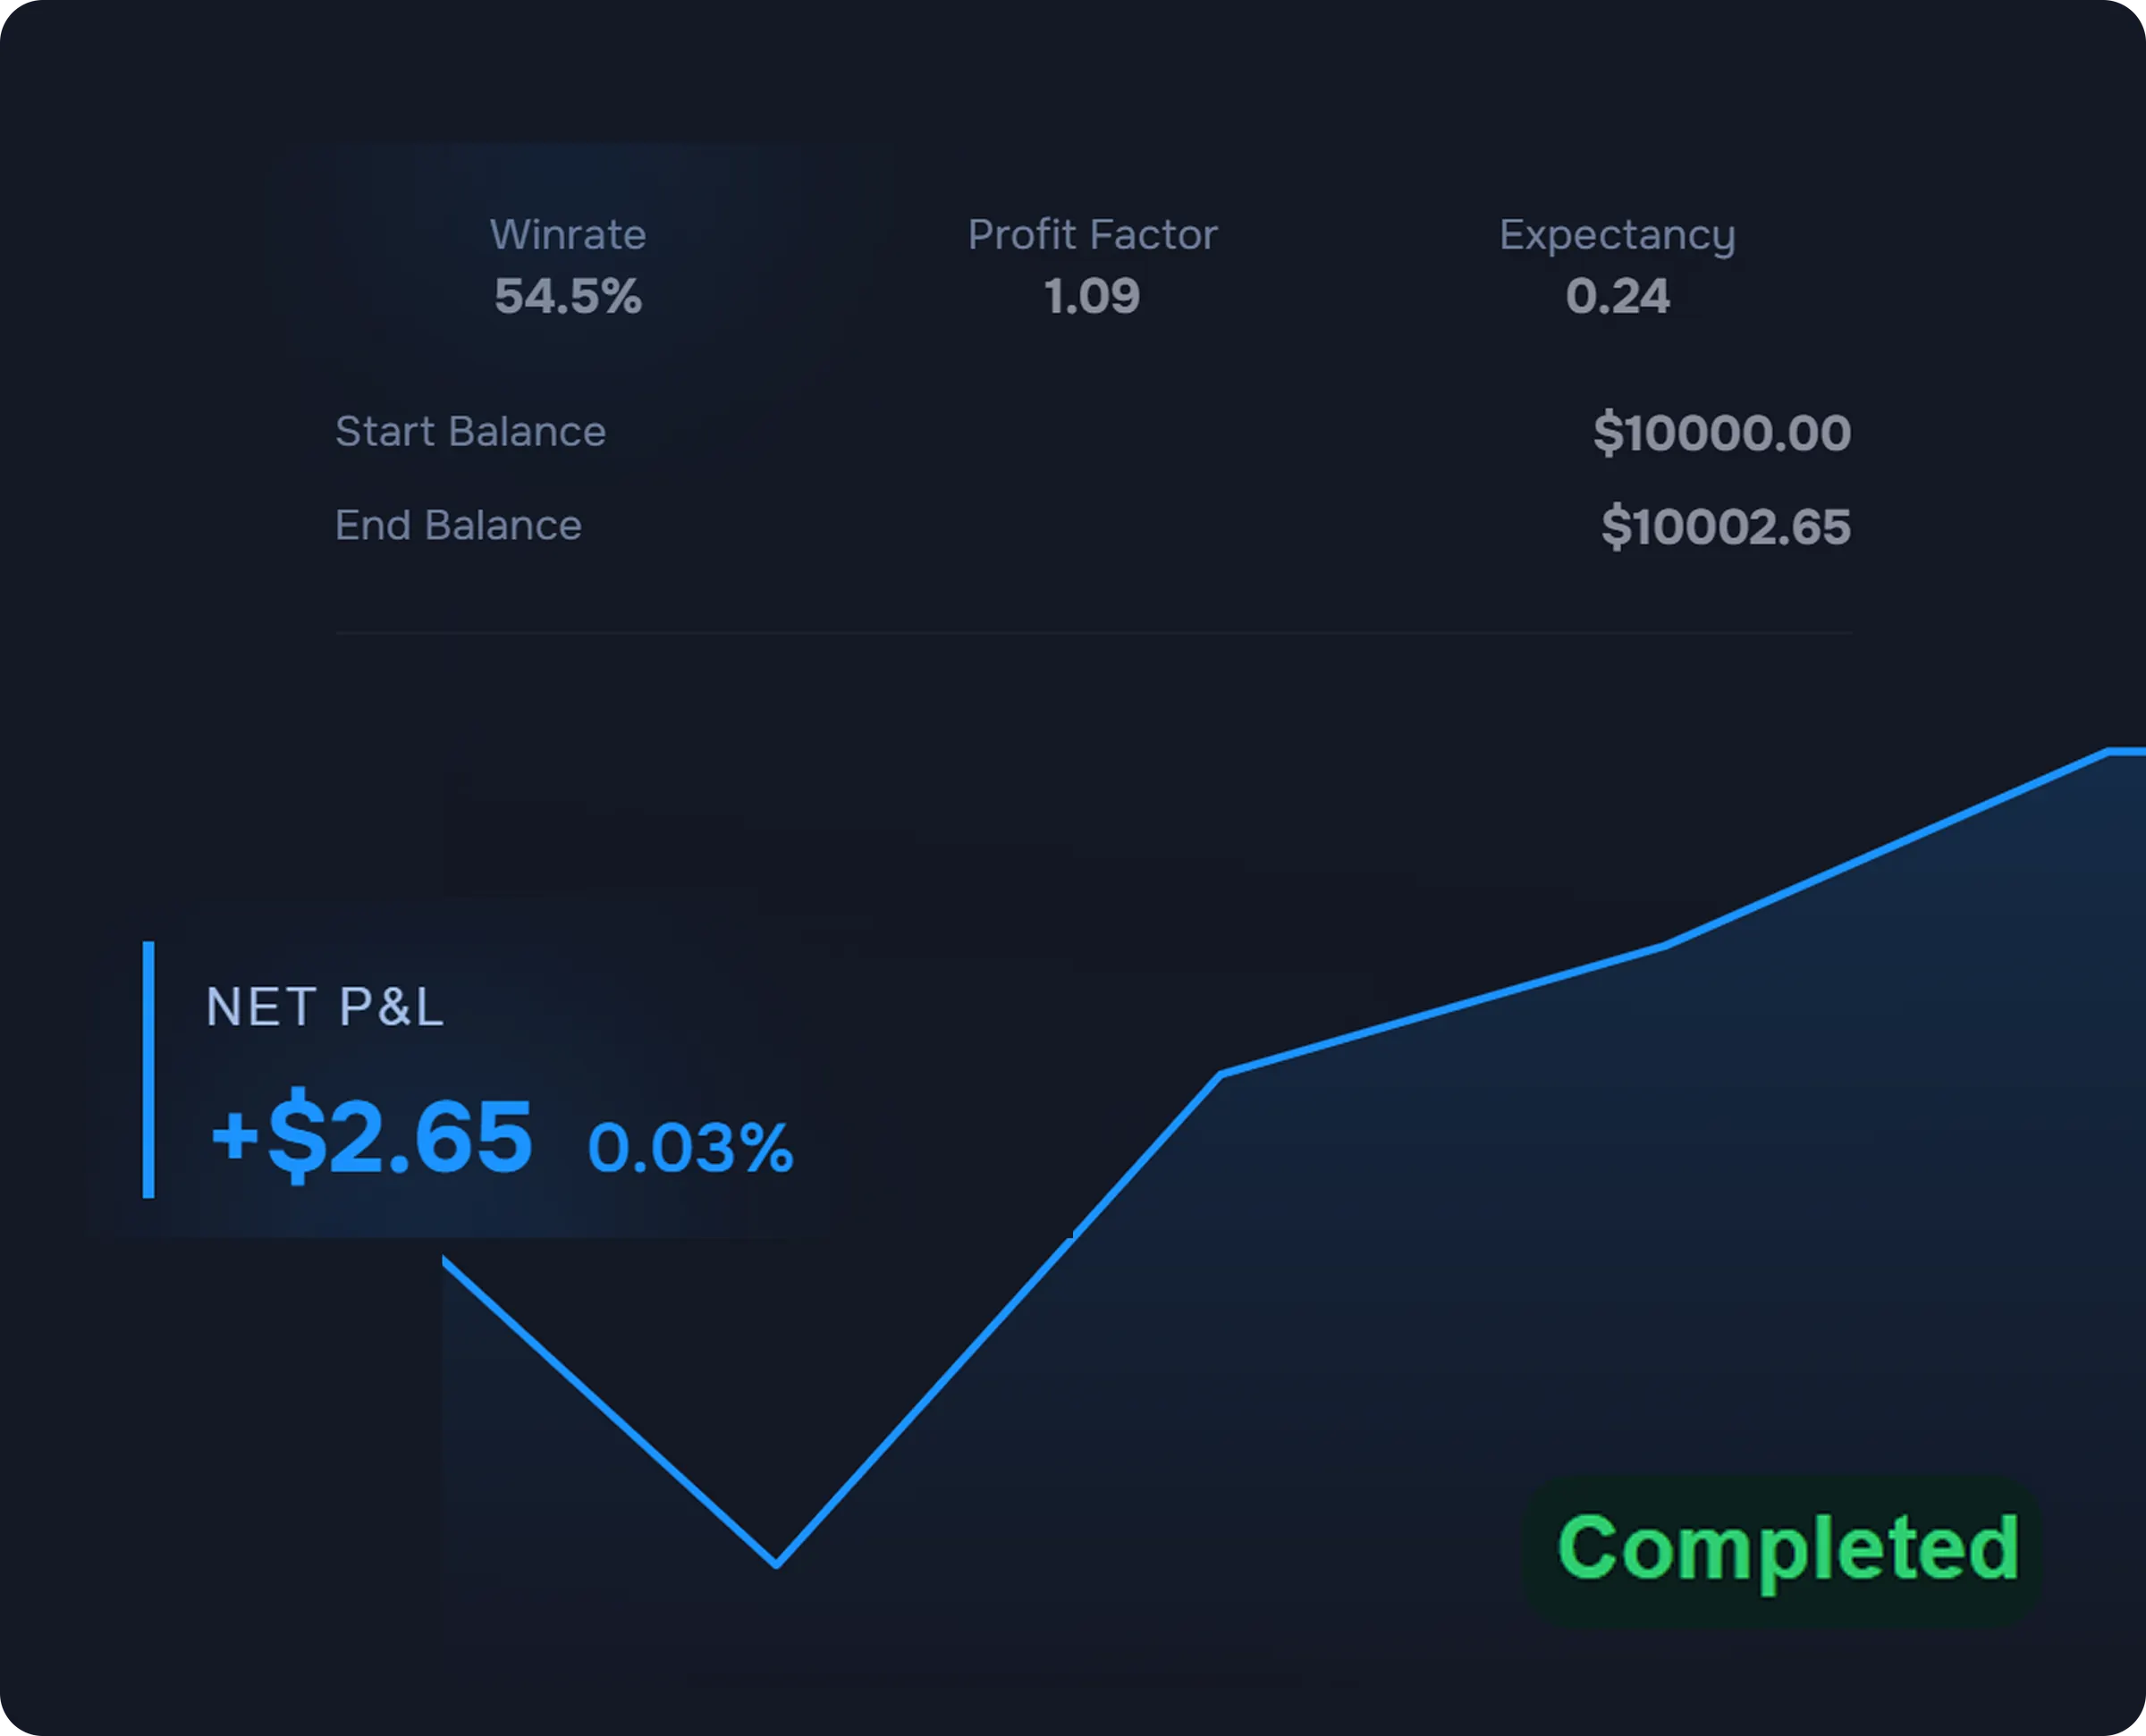
Most traders already review metrics such as profit factor, P&L calendar, and drawdown. The real benefit comes from pairing those metrics with charts and trade visualisations — seeing exactly what happened, trade by trade and candle by candle. A number might tell you that drawdown increased, but the chart shows when it happened, how it happened, and whether it was caused by market conditions or your execution.
That is also where a trade journal becomes valuable. The journal captures the decisions behind the numbers: whether you followed the plan, exited early, moved a stop, or increased size after a winning streak. Together, these tools help distinguish between profits generated by luck and profits generated by process. The goal is to make successful trades repeatable, not accidental.
Key takeaway: The right tools help you quantify risk before entering a trade and build confidence in a strategy before risking real capital.
Conclusion
You may not need more discipline. You may just need a better way to measure your trading.
Win rate alone can be misleading. To understand whether your strategy is actually working, expectancy, position sizing, risk-reward, and sample size all need to be part of the same review. Plan the risk before the trade, review the patterns after, and log the behaviour behind both.
That is where TraderWaves can help. With free calculators, analytics, and a trade journal in one workflow, you can move beyond guessing and start reviewing your performance with more context.
Can you be profitable with a low win rate?
What is risk reward ratio in trading?
What is profit factor in trading?
How can trading calculators help with risk management?
How does trade analytics help you manage risk?
Why is a trade journal important for risk management?
Can backtesting help with risk management?
Ready to journal?
Start Tracking Your Trades Today
Sign up now and access advanced trade journaling tools for free.
Start Free: No Credit Card