

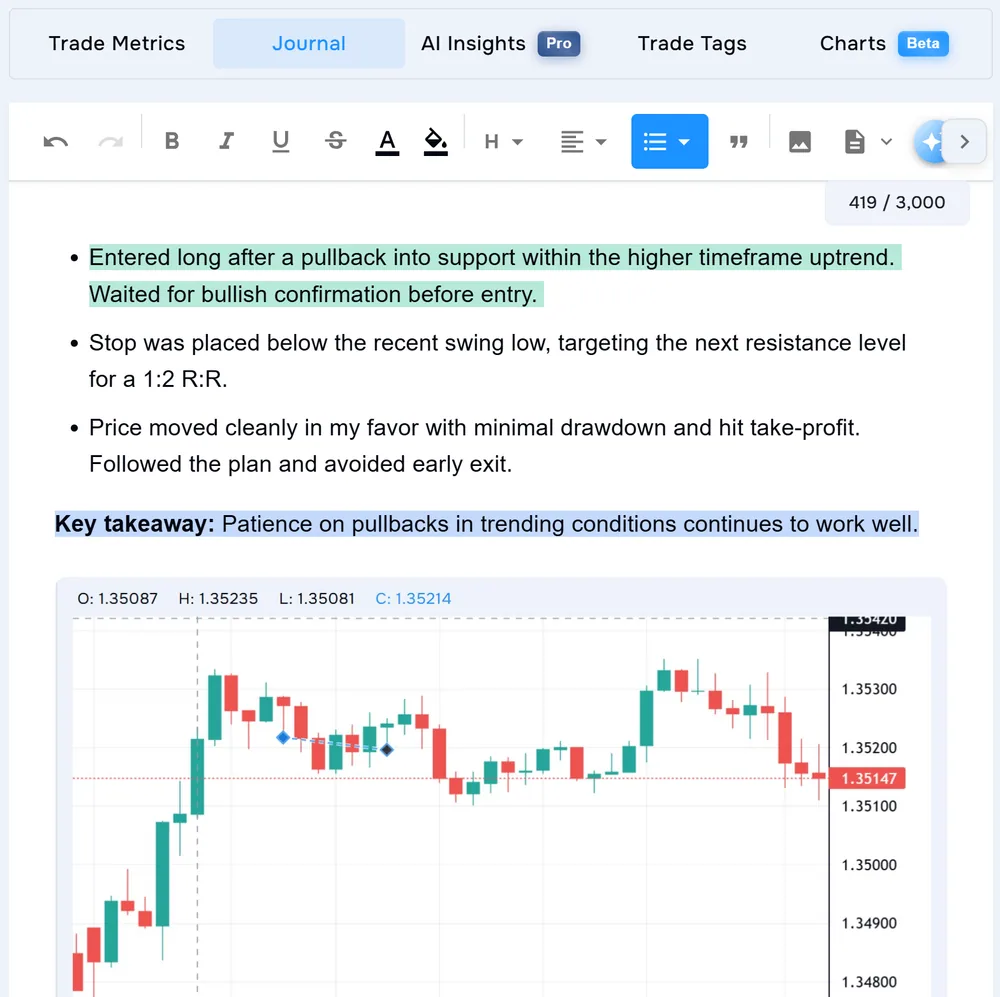
Why “best setup” is harder than it looks
Label setups the same way every time, review them with enough sample size, and judge risk-adjusted performance — not highlight-reel P&L.
1. Define your setups before you tag
Example — day trader on EUR/USD:
- London breakout — First 15-min break of Asian range after London open.
- Pullback to VWAP — Trend continuation entry at VWAP after impulse move.
- Range fade — Short at range high / long at range low in established chop.
- Keep names short and fixed — do not rename mid-month.
- One primary setup tag per trade.
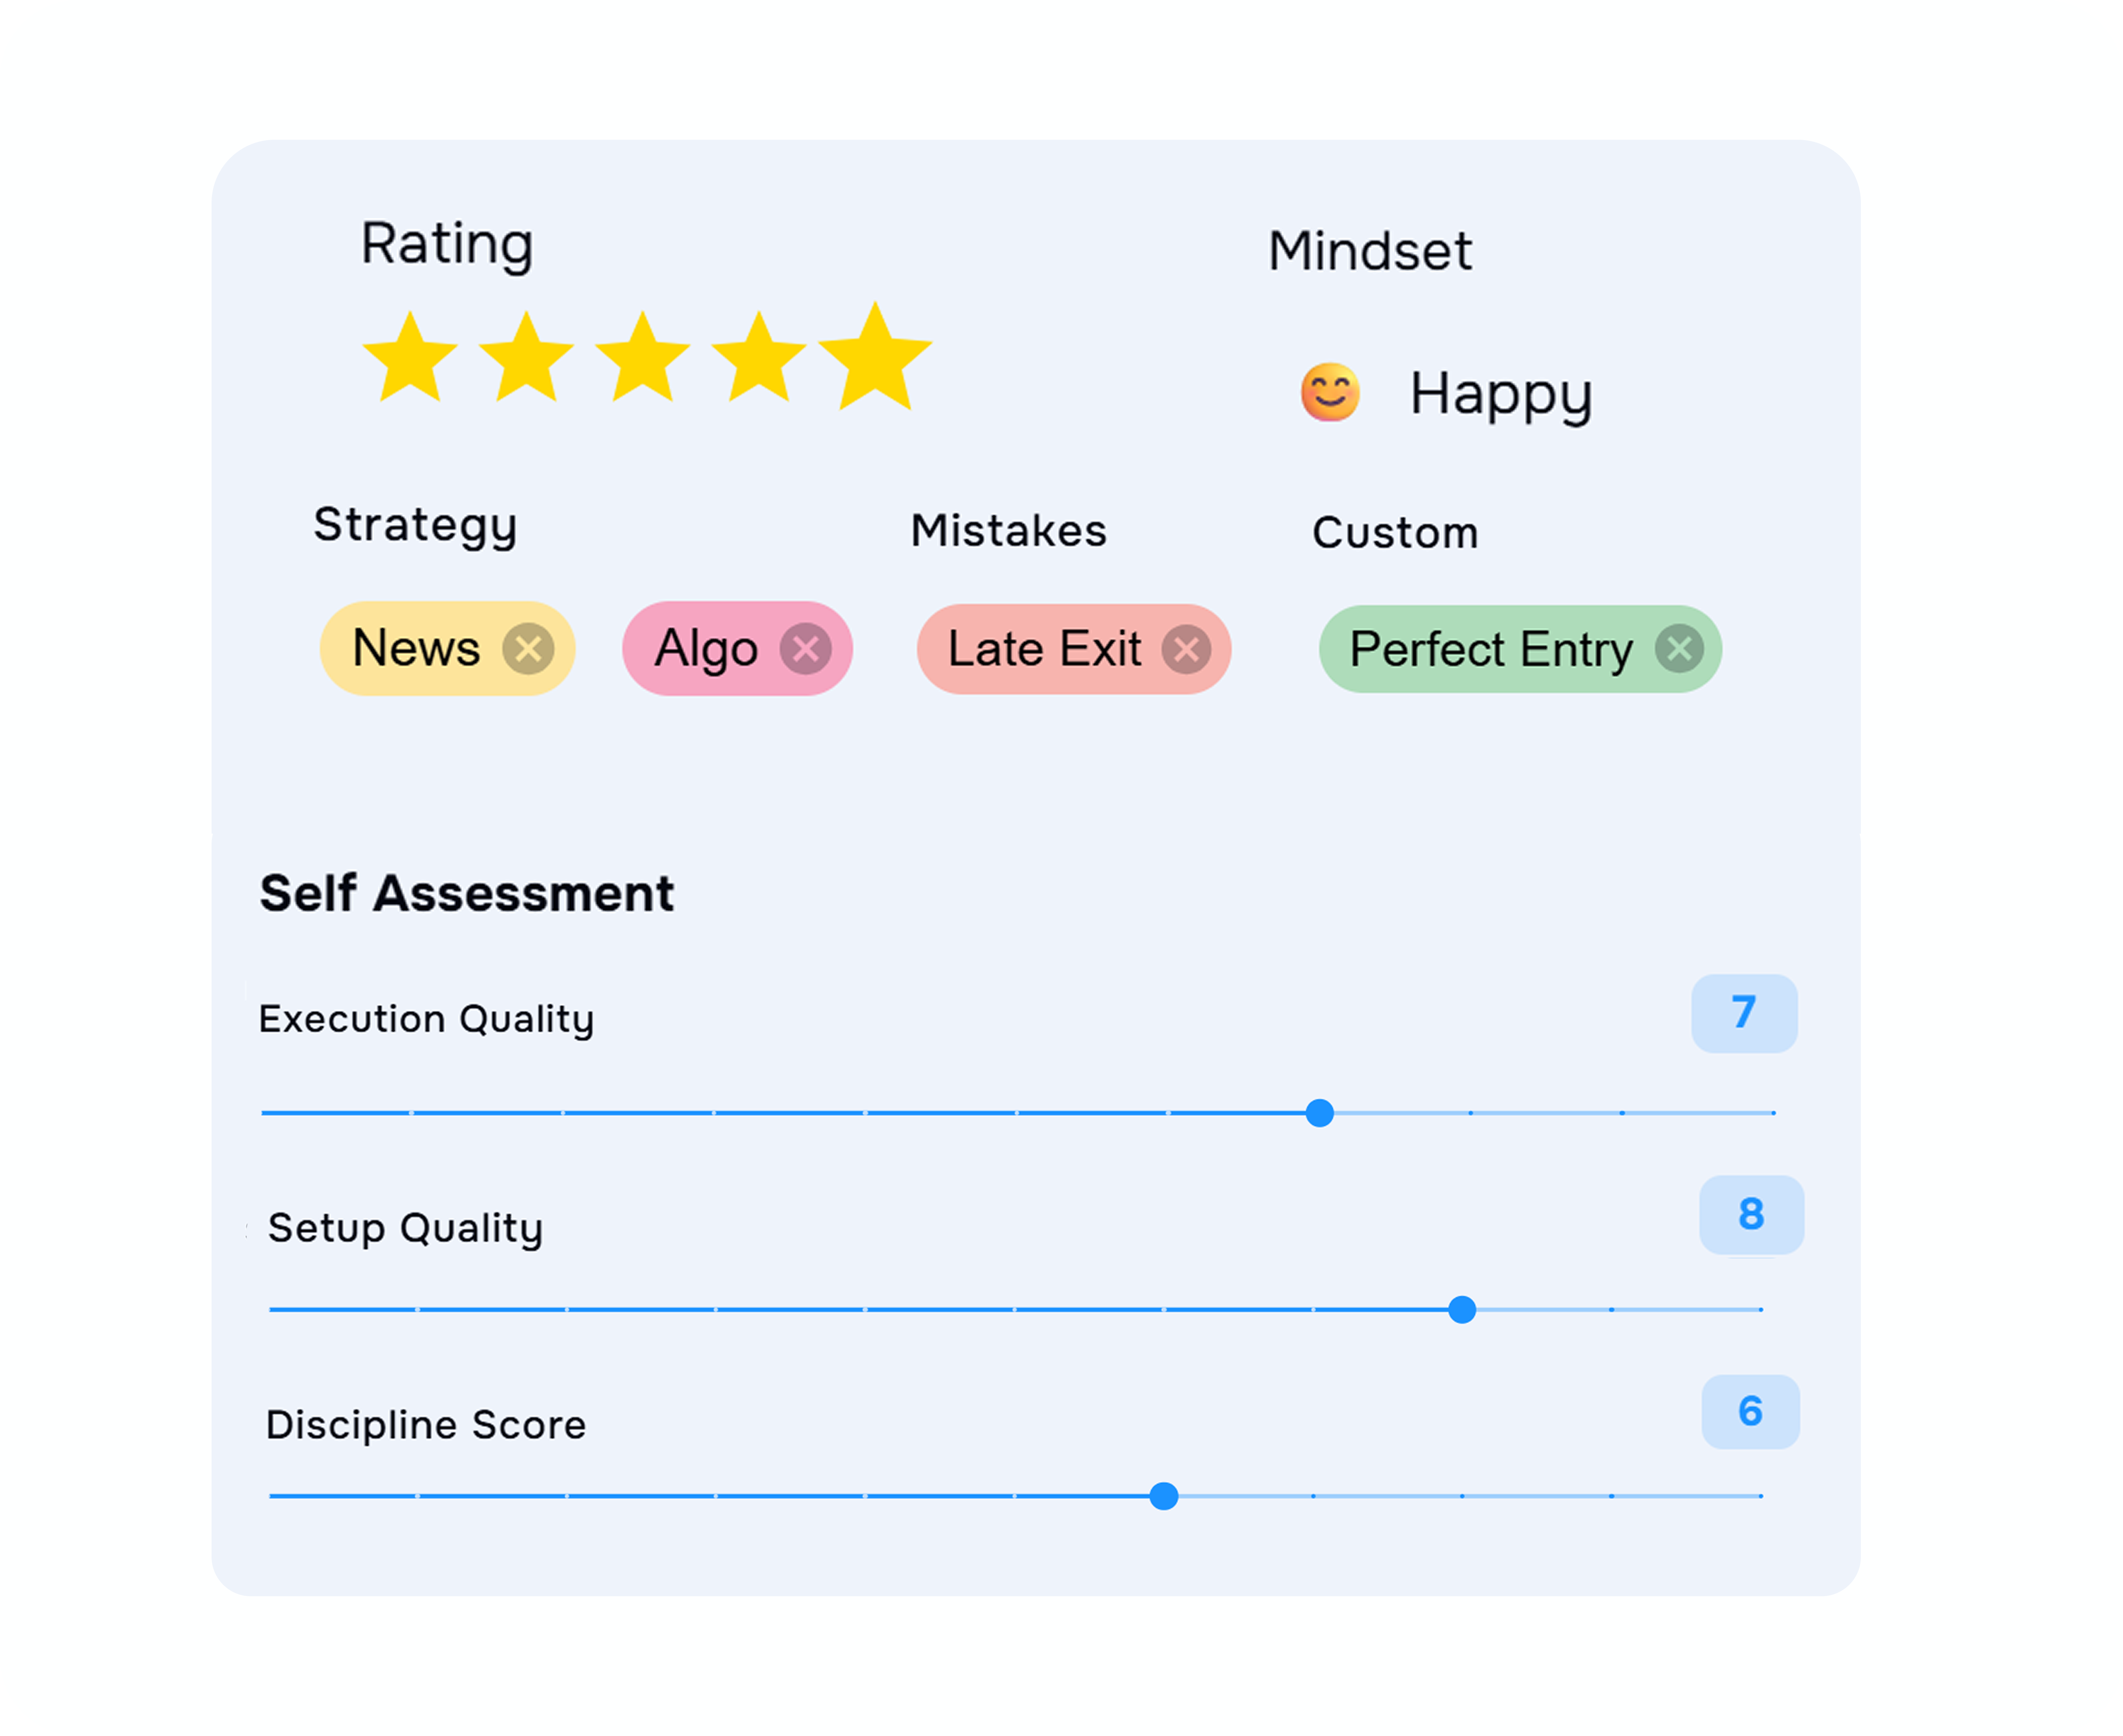
- Separate setup tags from mistake tags (
FOMO,revenge,oversized). Mistake tags explain why a good setup failed; they are not setups themselves.
TraderWaves includes system tag groups for normal journaling; creating your own custom tag groups is a Pro capability. See Journal Basics for the current tagging workflow.
2. Tag every trade — including losers
Minimum habit:
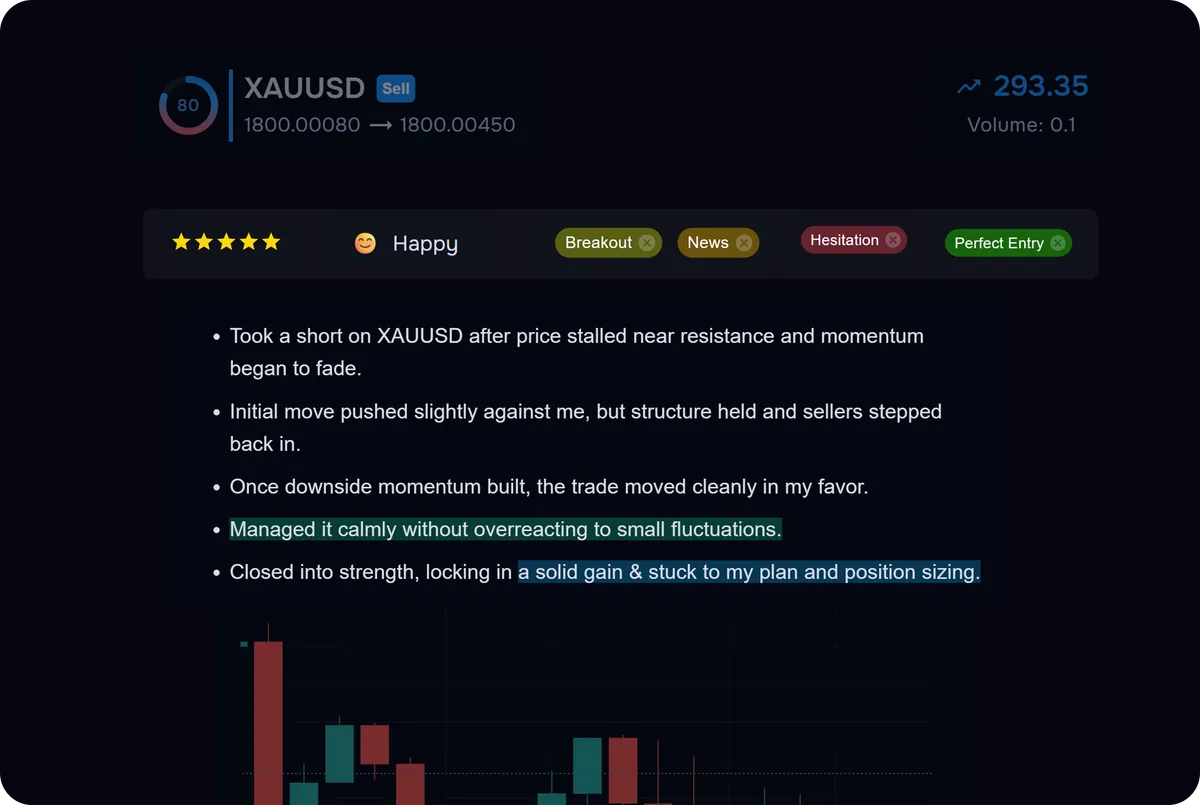
- Open the trade in your Journal after it closes.
- Add your setup tag.
- Add one context note if execution was off-plan (“entered early”, “moved stop”).
How many trades to tag per setup: Build at least 20–30 tagged trades per setup before a keep-or-cut decision. Under 15 trades, treat results as a directional hint only — keep trading and keep tagging. Do not judge a setup after five trades. If you trade infrequently, extend the window to 60–90 days per setup rather than forcing a call on 10 trades.
3. Compare setup performance in Reports
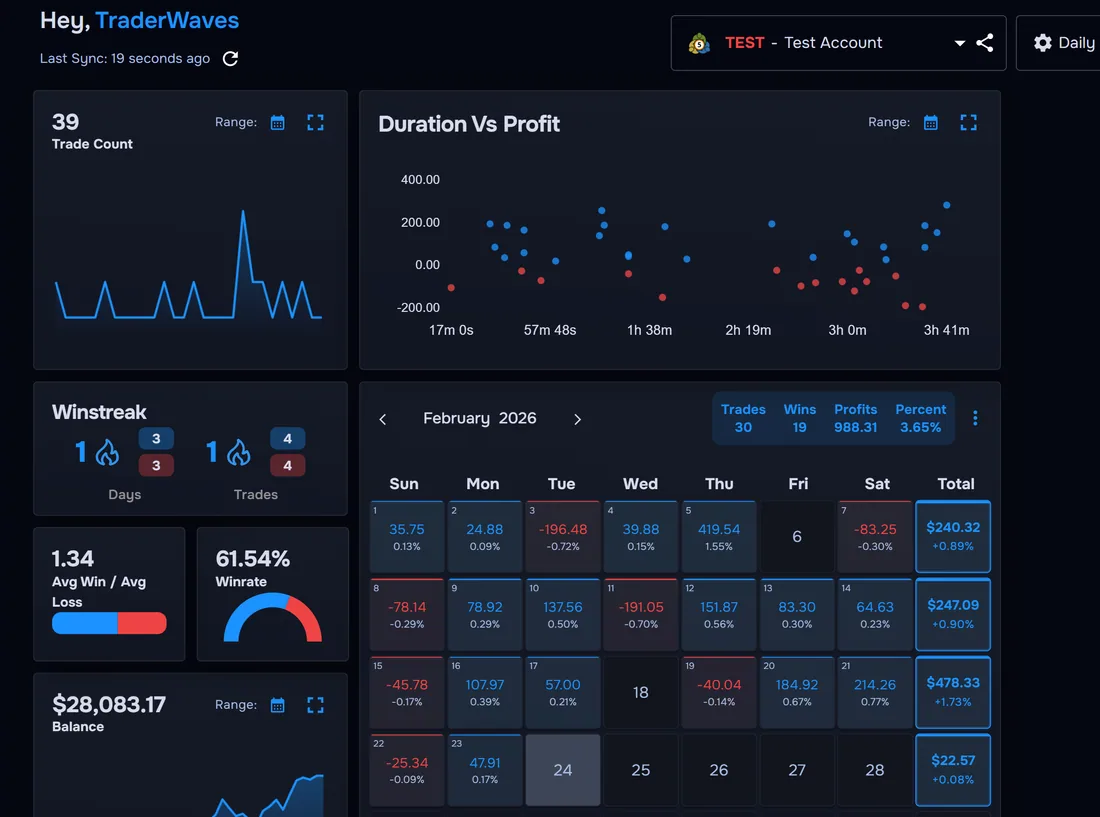
Compare the result and its reliability. Headline dollars can be distorted by account size, position size or a few unusually large trades. Use the same account and period, then read several metrics together:
- Trade expectancy — Average net amount made or lost per closed trade.
- Profit factor — Gross profit ÷ absolute gross loss.
- Payoff ratio — Average winner relative to the absolute average loser.
- Win rate — Context only; always pair it with payoff and expectancy.
- Trade count — The sample behind the comparison.
- Outcome concentration — Whether one or a few trades dominate the setup result.
Example read:
- London breakout: 34 trades, 48% win rate, positive expectancy, profit factor 1.6 → keep reviewing at standard size.
- Range fade: 28 trades, 61% win rate, negative expectancy, profit factor 0.92 → reduce or pause while reviewing losses.
- Pullback to VWAP: 19 trades, 37% win rate, positive expectancy, profit factor 1.9 → promising, but the sample remains limited.
4. Check execution quality and use AI Coach
On Pro, use WaveScore™ to review entry quality, exit quality, risk management, and tempo alongside your journal data. A setup with decent P&L but weak exit scores may be profitable because of luck, not skill — worth tightening before you size up.
Ask: Am I executing Setup A cleanly and Setup B sloppily? If yes, the problem may be familiarity or rules clarity, not the setup itself.
After your manual review, ask Wave AI Coach (Pro) questions grounded in your tagged data:
- “Which setup has the best expectancy over the last 90 days?”
- “Do I perform worse on range fades after a losing day?”
- “Which setup has the widest gap between win rate and average R?”
London breakout trades tagged FOMO — so you separate setup edge from behavioural leaks. AI supports your review; it does not replace the tagging habit in Step 2.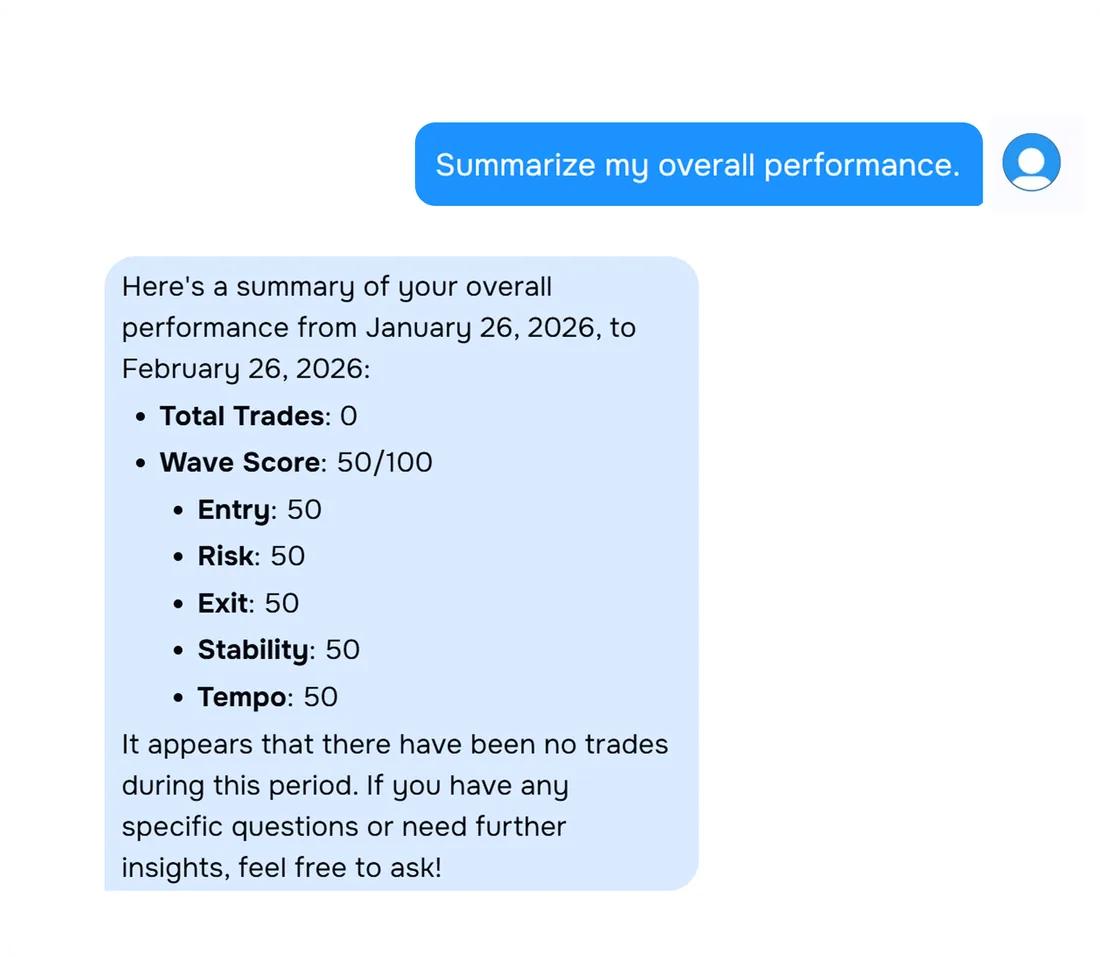
5. Decide — cut, keep, or refine
- Is expectancy positive after 30+ trades?
- Is max drawdown during this setup’s trades acceptable?
- Does position sizing stay within the plan you set in Step 1?
- Would this setup pass your daily loss limit if you traded it every session?
- Keep: Positive expectancy, 30+ trades, acceptable drawdown — standard size; trade only in conditions that match your tagged winners.
- Reduce: Mixed metrics or small sample with warning signs — half size until 30 trades; stricter entry rules.
- Cut: Negative expectancy over 30+ trades, or repeated rule breaks — stop trading it for 30 days; validate revisions in the backtester or paper trade before bringing it back.
- Refine: Good concept, poor execution scores — tighten rules; journal planned vs actual for 20 trades. If the idea still looks sound on paper, use the backtester to test rule changes across more market conditions before sizing up.
Worked example: narrowing three setups to one focus
After 90 days and 71 tagged trades:
- Opening drive — 26 trades, +0.55R expectancy, profit factor 2.1, WaveScore exit score strong → primary setup, full size.
- Midday reversal — 22 trades, +0.12R expectancy, profit factor 1.1, many trades tagged
late entry→ refine rules, half size. - Afternoon breakout — 23 trades, −0.31R expectancy, profit factor 0.78, largest losers clustered here → cut for 30 days.
FAQs
How many trades do I need before I know a setup works?
Aim for at least 30 tagged trades per setup before making a final keep or cut decision. Below 15 trades, treat results as preliminary and keep tagging.
Should I compare trading setups by win rate or profit?
Use expectancy and profit factor together. Win rate alone is misleading because a high win rate setup can still lose money if average losses exceed average wins.
What if I only trade one setup?
Tag sub-variations such as session, direction, or entry type instead of multiple setup names. You still need comparison dimensions to find what works best.
Can I find my best setup without tagging every trade?
Not reliably. Untagged trades skew your averages and hide which ideas actually drive your profit and loss.
Do I need TraderWaves Pro to compare setups?
Core Reports and system-tag filtering are currently available without a Reports-specific entitlement. Custom tag groups, WaveScore data and AI coaching are Pro capabilities, and future Reports packaging may differ by feature.
What should I do with a setup that wins often but loses overall?
Cut position size immediately and review whether targets are too tight or stops too wide. Check mistake tags for early exits, moved stops, and other execution errors.